Current United States Data
- Total number of abortions in the U.S. 1973-2020: 63.6 million +
- 199 abortions per 1,000 live births (according to the Centers for Disease Control)
- U.S. facility-provided abortions in 2025: ~1,125,930 (Guttmacher Institute)
- Abortions per day: ~3,085 (GI)
- Abortions per hour: ~129 (GI)
- 1 abortion every 28 seconds (GI)
- 16.7 abortions/1,000 women aged 15-44 in 2025 (GI)
- 20.6% of pregnancies in 2020 ended in abortion, compared to 18.4% in 2017 (GI)
- Pill abortions account for 63% of all U.S abortions in 2023 (GI)
These statistics include only surgical and pill abortions. Because many contraceptive measures are abortifacients (drugs that induce or cause abortions), it is important not to overlook the number of children killed by chemical abortions.
According to the National Survey of Family Growth (NSFG) conducted by the CDC’s National Center for Health Statistics, the most recent data (2022–2023) show that 54.3% of U.S. females ages 15–49 were currently using some form of contraception. This includes abortifacient methods such as oral contraceptive pills (11.4%) and long-acting reversible contraceptives (LARCs) such as IUDs or implants (10.4%). The NSFG data brief estimates the total population of females in this age group at approximately 74.9 million (74,937,000). Applying the 54.3% figure yields roughly 40.7 million women currently using contraception.
Using formulas based on the way the birth control pill works, pharmacy experts project that about 14 million chemical abortions occur in the United States each year, providing a projected total well in excess of 1.02 billion contraceptive abortions between 1965 and 2025.
When conducting research on abortion statistics, you may also encounter two different sets of numbers. One set is from the Centers for Disease Control, and the other is from the Guttmacher Institute—the “independent research arm” of Planned Parenthood Federation of America.
The Guttmacher Institute totals are actually the more accurate since the Institute conducts private research on abortion providers throughout the country and because not all states are required to report to the CDC. In fact, California and New York—where high numbers of abortions occur—are not included in CDC figures.
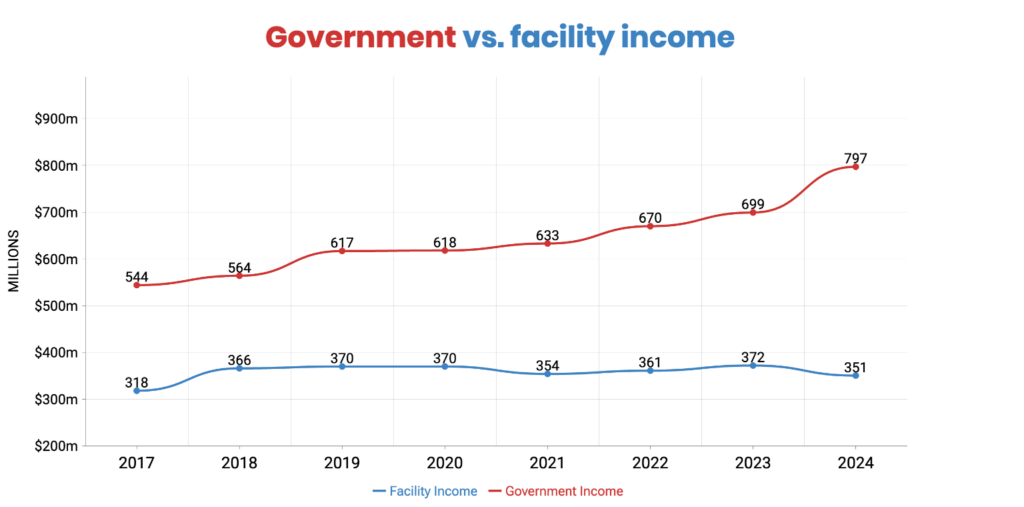
Planned Parenthood’s income breakdown for the 2023-2024 fiscal year
- PP non-government clinic income: $350.5 million
- PP donations revenue: $684.1 million ($1.87 million/day)
- PP government grants and reimbursements: $792.2 million ($2.17 million/day)
- Total profit: $27.4 million
- Total income: $2.026 billion ($55.5 million/day)
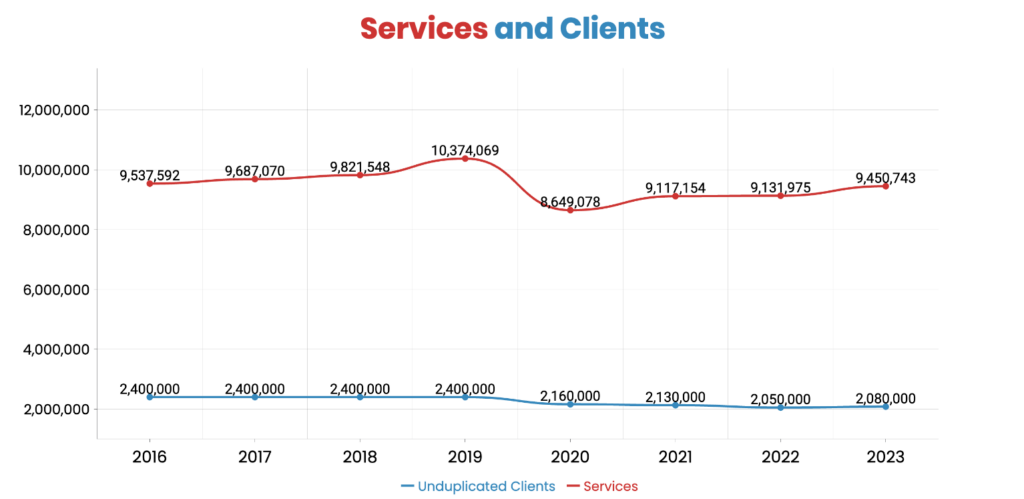
2022-2023 Planned Parenthood service numbers
- Number of abortions (medical and surgical): 402,230
- Total number of abortions per week: 7,735
- Total number of abortions per day: 1,102
- Average time between abortions: 78 seconds (1 min, 18 sec)
- Adoption referrals: 2,148
- Ratio of adoption referrals to abortions: 1 per 187
Non-Hispanic Black Abortions by PP
According to the CDC 38% of abortions are done on non-Hispanic Black mothers. Using this data:
- Per year estimate: 134,850
- Per day estimate: 369
- Per hour estimate: 15
2021 PP Annual Survey
- Total PP facilities: 567
- Total PP facilities that perform surgical and medical abortions: 391
- Total affiliates: 49
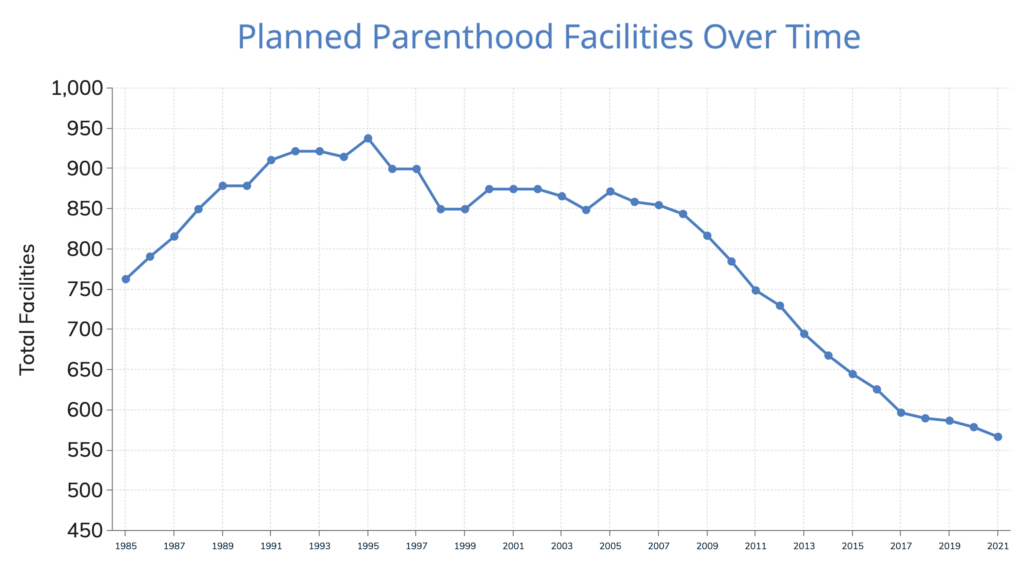
Helpful information
- Highest number of PP facilities: 938 in 1995
U.S. total females, Age 15-44
(according to 2020 U.S. census)
- White: 72.9% (47,029,969)
- Black: 15.1% (9,748,829)
- Other: 8.8% (5,683,408)
TOTAL: 64,543,832
U.S. women who obtained abortions in 2021
(according to Centers for Disease Control)
- White: 30.2% of all abortions; 6.4 abortions per 1000 women; ~1 abortion per 10 live births
- Black: 41.5% of all abortions; 28.6 abortions per 1000 women; ~1 abortion per 2 live births
- Hispanic: 21.8% of all abortions; 12.3 abortions per 1000 women; ~1 abortion per 5 live births
- Other: 6.5% of all abortions; 9.2 abortions per 1000 women; ~1 abortion per 6 live births
U.S. women fertility rates per 1 woman
(according to the National Center for Health Statistics)
- 1990: White: 1.85 Black: 2.55 Hispanic: 2.96
- 2010: White: 1.79 Black: 1.97 Hispanic: 2.35
- 2018: White: 1.64 Black: 1.79 Hispanic: 1.96